Training Compute of Frontier AI Models Grows by 4-5x per Year
Our expanded AI model database shows that the compute used to train recent models grew 4-5x yearly from 2010 to May 2024. We find similar growth in frontier models, recent large language models, and models from leading companies.

Published
Resources
Introduction
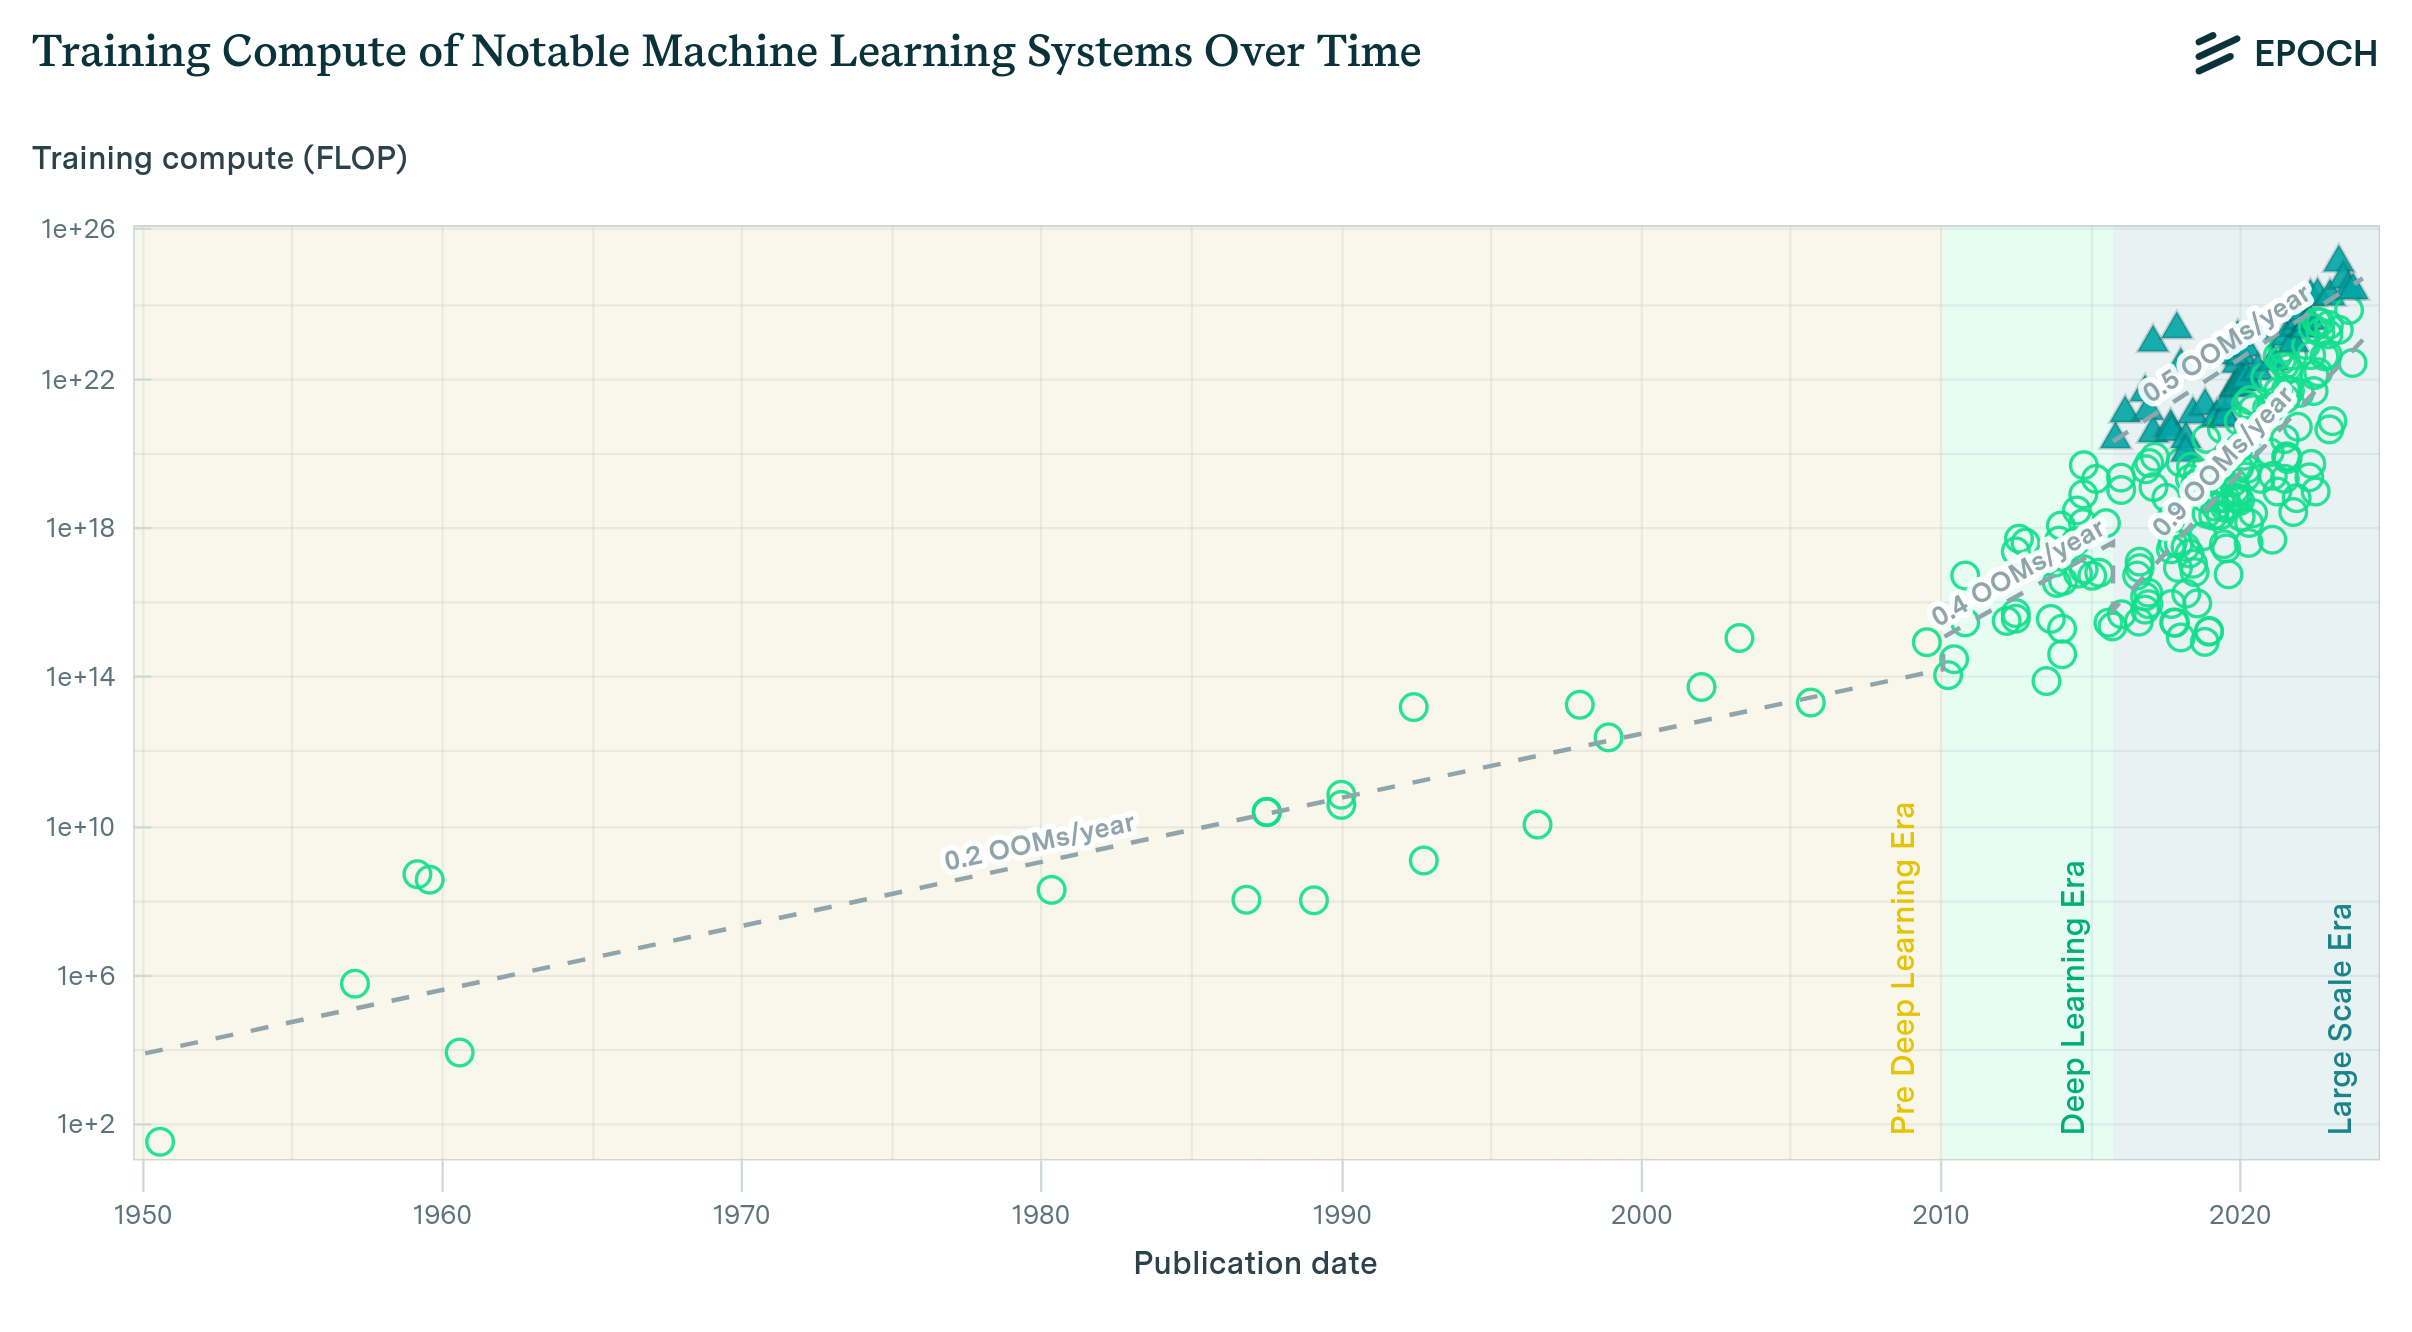
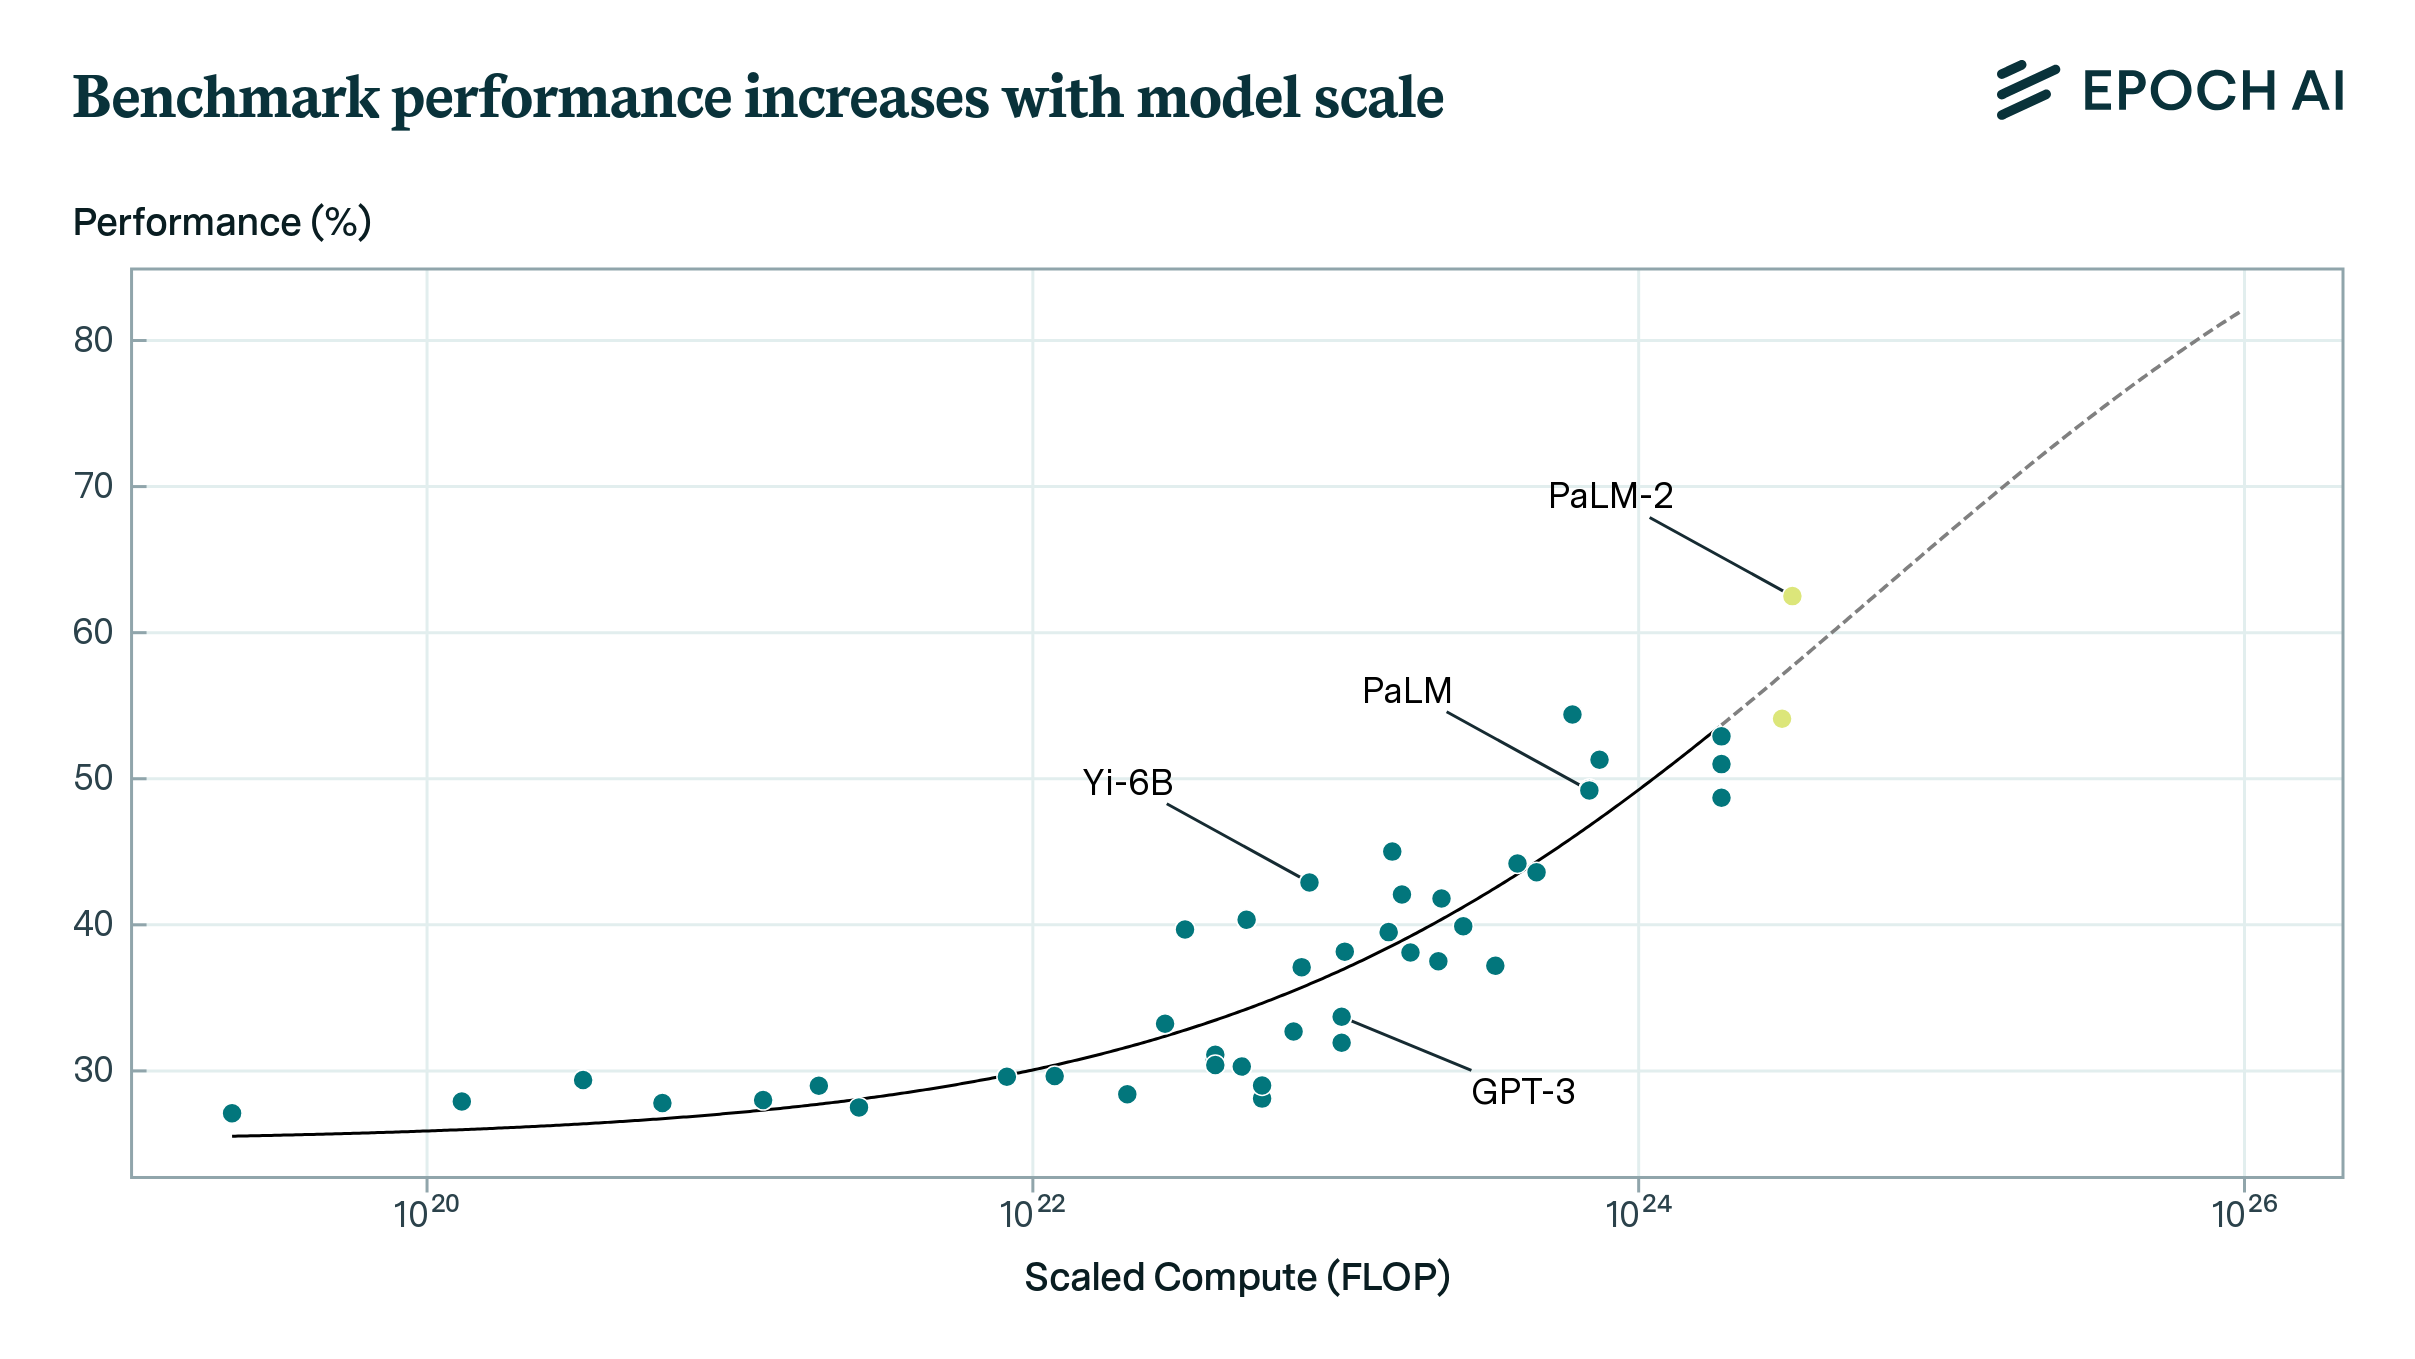
Over the last ten years, we have witnessed a dramatic increase in the computational resources dedicated to training state-of-the-art AI models. This strategy has been incredibly productive, translating into large gains in generality and performance. For example, we estimate that about two-thirds of the improvements in performance in language models in the last decade have been due to increases in model scale.
Given the central role of scaling, it is important to track how the computational resources (‘compute’) used to train models have grown in recent years. In this short article, we provide an updated view of the trends so far, having collected three times more data since our last analysis.
We tentatively conclude that compute growth in recent years is currently best described as increasing by a factor of 4-5x/year. We find consistent growth between recent notable models, the running top 10 of models by compute, recent large language models, and top models released by OpenAI, Google DeepMind and Meta AI.
There are some unresolved uncertainties. We cannot rule out that the overall trend of compute might have accelerated. We also find evidence of a slowdown of growth in the frontier around 2018, which complicates the interpretation, and recent frontier growth since 2018 is better described as a 4x/year trend. We also find a significantly faster trend for notable language models overall, which have grown as fast as 9x/year between June 2017 and May 2024. However, when focusing on the frontier of language models, we see that the trend slows down to a ~5x/year pace after the largest language models catch up with the overall frontier in AI around mid-2020.
All in all, we recommend summarizing the recent trend of compute growth for notable and frontier models with the 4-5x/year figure. This should also be used as a baseline for expectations of growth in the future, before taking into account additional considerations such as possible bottlenecks or speed-ups.

Figure 1: Summary of the compute growth trends we found for overall notable models (top left), frontier models (top right), top language models (bottom left) and top models within leading companies (bottom right). All point to a recent trend of 4-5x/year growth.
The overall trend of training compute growth has held
We have previously investigated the trend of growing training compute. In 2022, we found that the amount of compute used to train notable ML models had grown about 4x per year from 2010 to 2022.1 Many notable models have been released since, and we have expanded our database by tripling the number of compute estimates,2 so an update is in order.
In short, we find that the amount of compute used to train notable models has grown about 4.1x/year (90% CI: 3.7x to 4.6x) between 2010 to May 2024.3 If we look at the trend since our last update in Feb 2022, we find that training compute has grown about 4.4x per year (90% CI: 1.5x to 11.8x) – note the wide confidence interval. Both estimates are consistent with our previous estimate, suggesting that the trend has held.
For context, a notable model is one that meets our notability criteria: either a) be presented in a highly cited paper (>1000 citations), b) demonstrate a state-of-the-art result in a well-recognized benchmark, c) be of historical importance or d) be deployed in a product with significant use. Our database of notable models is not comprehensive, and there are many models either missing or for which we could not provide a training compute estimate. See more details about our data in our documentation.
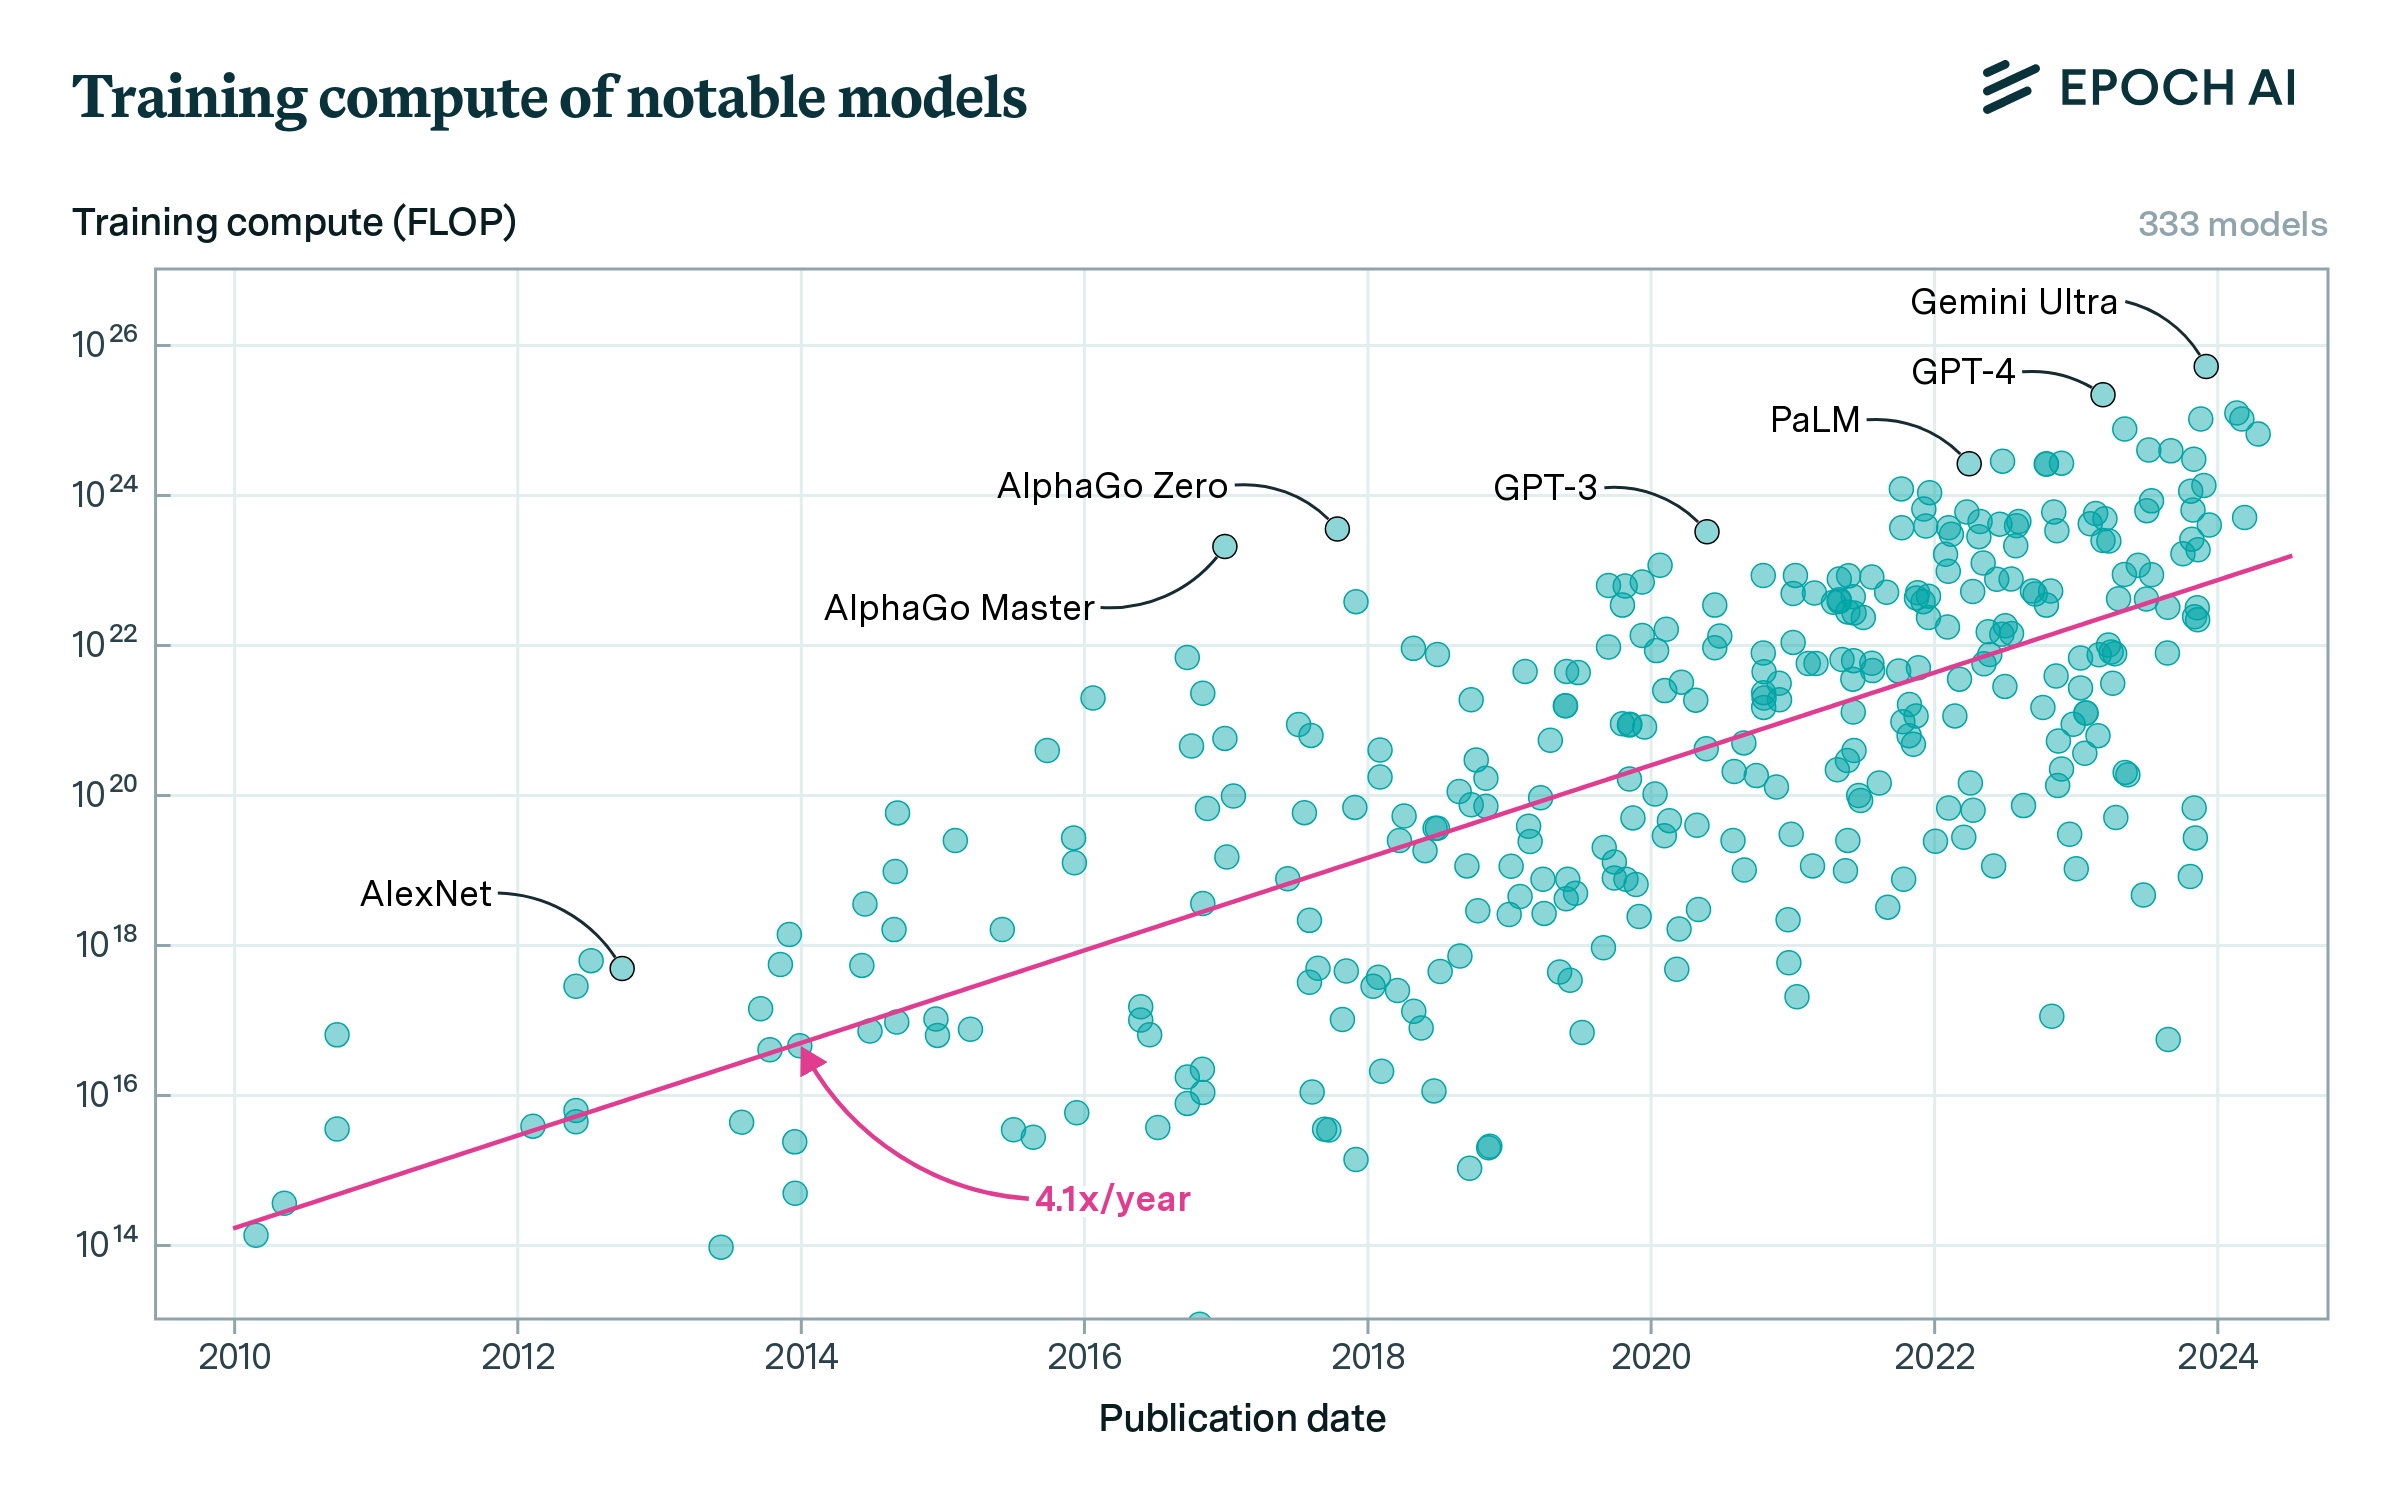
Figure 2: Trend in the amount of compute used to train the ML models at the frontier of scale.
We also study possible changes in the trend of compute growth. We consider a discrete acceleration of the growth rate, a discontinuous break of the exponential trend, and hyperbolic growth. We find that neither model is robustly preferred over simple exponential growth, with some caveats.4 We ultimately cannot rule out an acceleration from the data we have, but further investigating this possibility is outside the scope of this work.
Frontier model growth has slowed, and now aligns with overall trends
Of course, the models that interest us most are those at or near the frontier. We now focus on models that were in the top 10 of training compute when they were released, which we will refer to as frontier models. The trend that we observe in frontier models is similar to the recent trend in overall models, increasing at 5.3x/year (90% CI: 4.9x to 5.7x) between 2010 and May 2024.
Note that we used a different definition of frontier models in our previous paper.5 We now prefer our updated, simpler definition of frontier models, as models in the running top 10 of training compute. This new definition has the advantage of being less sensitive to outliers and to models with low compute, and we have found that it corresponds better to what we intuitively consider frontier models. Our new definition has consequences on the results we highlight, as the trend among frontier models according to our new definition is noticeably faster than with our previous definition.6 We also investigate whether the trend in frontier models is sensitive to the choice of how many models to include in the running top, and conclude that it is not.7
Now, we turn to the question of whether the trend in frontier models has changed over time. Previous research has found some suggestive evidence of a deceleration of growth in frontier models. In particular, in our February 2022 paper we found a slower growth rate for large-scale models in the 2016 to 2022 period.8 More recently, Lohn (2023) analyzed Epoch data and found a slowing trend of compute for frontier models after around 2017.9
With our updated definition of frontier models, we are able to replicate a similar result. We find strong evidence of a slowdown of growth sometime in the last decade. While other alternative descriptions are possible, we prefer summarizing the trend as slowing down to 4.2 x/year (90% CI: 3.6x to 4.9x) after 2018 (80% CI: Oct 2016 to Aug 2019). See Figure 3.10
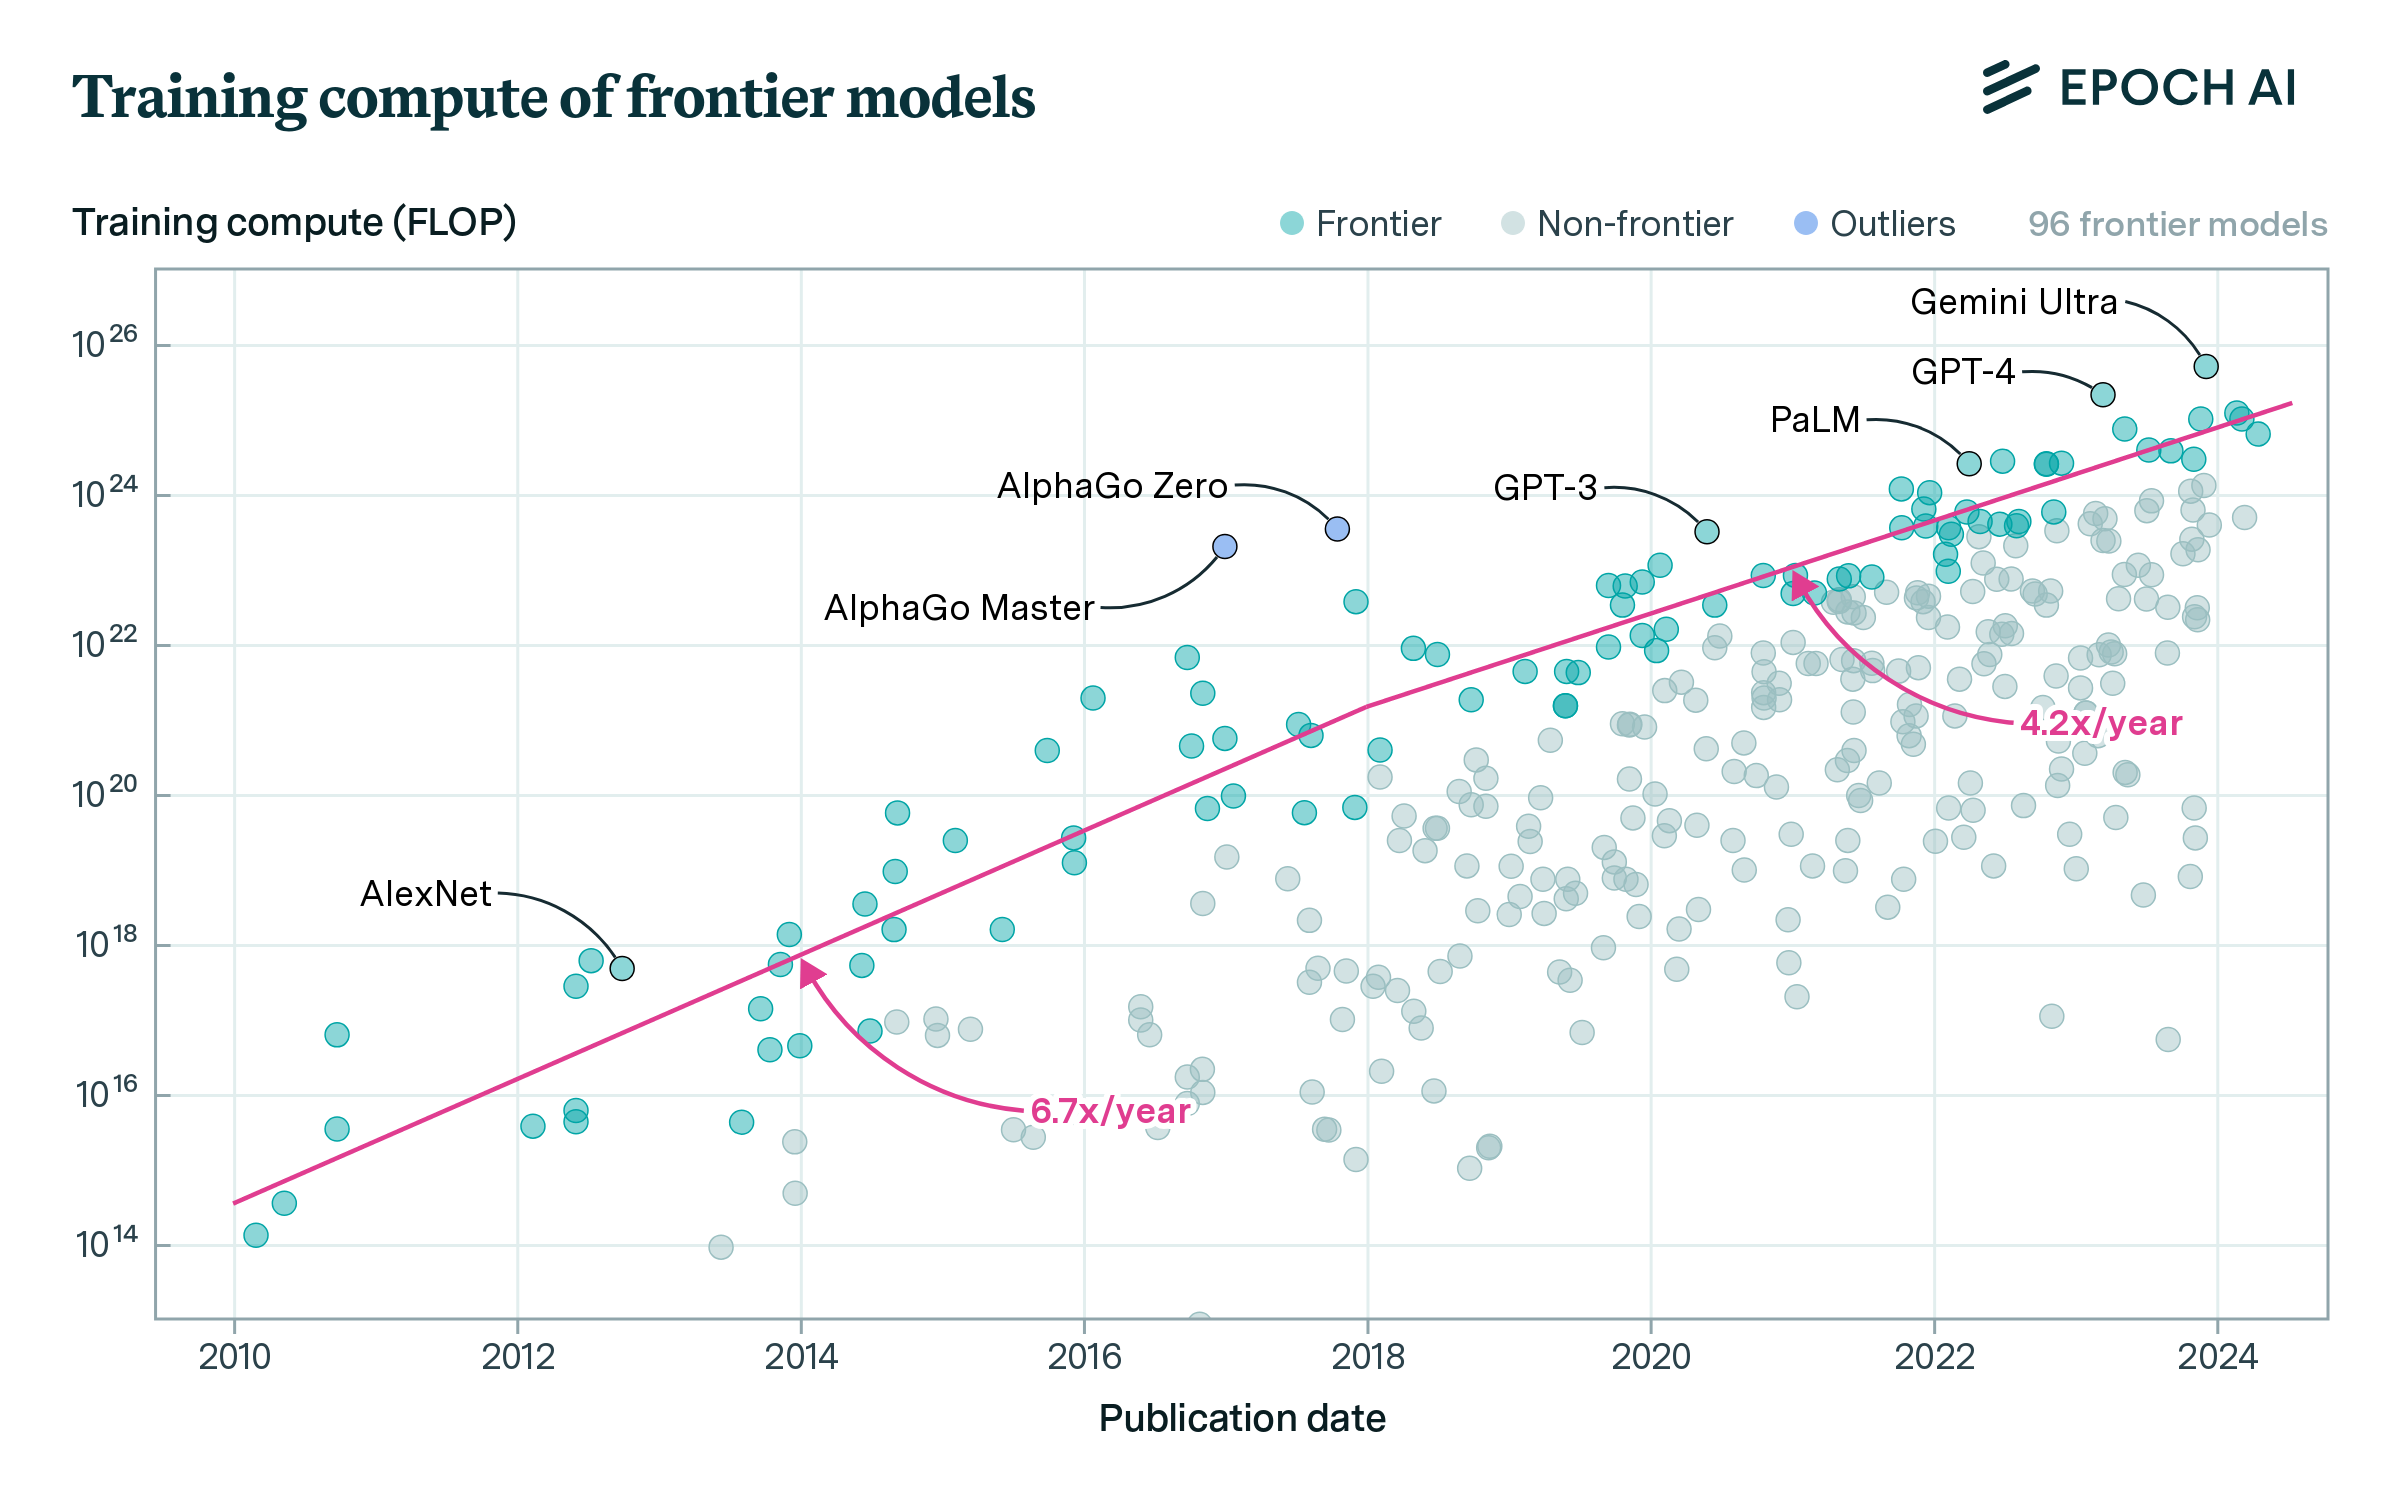
Figure 3: Trend representing the slowdown of compute growth in the frontier of scale, excluding AlphaGo Master and AlphaGo Zero. Note that the growth rates and date of the slowdown aren’t robust, as they are sensitive to the date of the break, whether we include compute outliers and whether we allow for a discontinuous break.
We don’t have enough information to discern what caused this slowdown. One plausible story is that between 2010 and 2018 we were in a ‘compute overhang’, where ML experiments were small-scale relative to available compute. Developers realized that deep learning methods could be scaled with good results, and so pushed to increase performance using small but rapidly growing GPU clusters. However, growing beyond ~1e22 FLOP required large dedicated clusters and better hardware, and so the trend slowed down. However, we are not confident in this explanation.
Note that for deriving this trend we excluded two compute outliers: AlphaGo Master and AlphaGo Zero. These are non-central examples of modern machine learning – they are game-playing systems that were trained through an intensive reinforcement learning process, and most of their training compute was used in game simulations to generate data. When included, they single-handedly warp the trend of compute in frontier models, suggesting faster growth before their release and slower afterwards. In particular, if we include the AlphaGo models the best fit becomes a model with a discrete slowdown in 2018 (90% CI: Dec 2016 to Jan 2018) and a recent growth rate of 3.3 x/year (90% CI: 2.8x to 4.1x).
Our takeaway is that growth in the frontier in recent years is best described as growing by 4x/year, but we are not confident in our interpretation – the trend is sensitive to many choices, including whether we allow for discontinuous growth and whether we exclude compute outliers.
Language models caught up to the frontier around 2020
Currently, the most relevant models to pay attention to are language models (including multimodal models like GPT-4). We have seen major advances in generative language models in recent years, and they power some of the most successful applications such as ChatGPT.
We focus on models including and after the release of the Transformer in June 2017, as our data before then is scarce.11 The trend for notable language models grows noticeably faster than for notable models overall, growing 9.5 x/year (90% CI: 7.4x to 12.2x) between June 2017 and May 2024. The central estimate is almost twice as fast as the trend for notable models, albeit with significant uncertainty.
The faster growth trend might reflect how language models started from a low baseline and climbed up the frontier of the field after gaining popularity, before decelerating once they reached the frontier. We investigate the running top 10 language models by compute, and find evidence of a deceleration around mid-2020 (90% CI: April 2019 to Dec 2021) – close to the launch of GPT-3. Growth after the deceleration and until May 2024 is around 5.0x/year (90% CI: 3.1x to 7.3x) – similar to the overall trend of frontier models (see Figure 4).
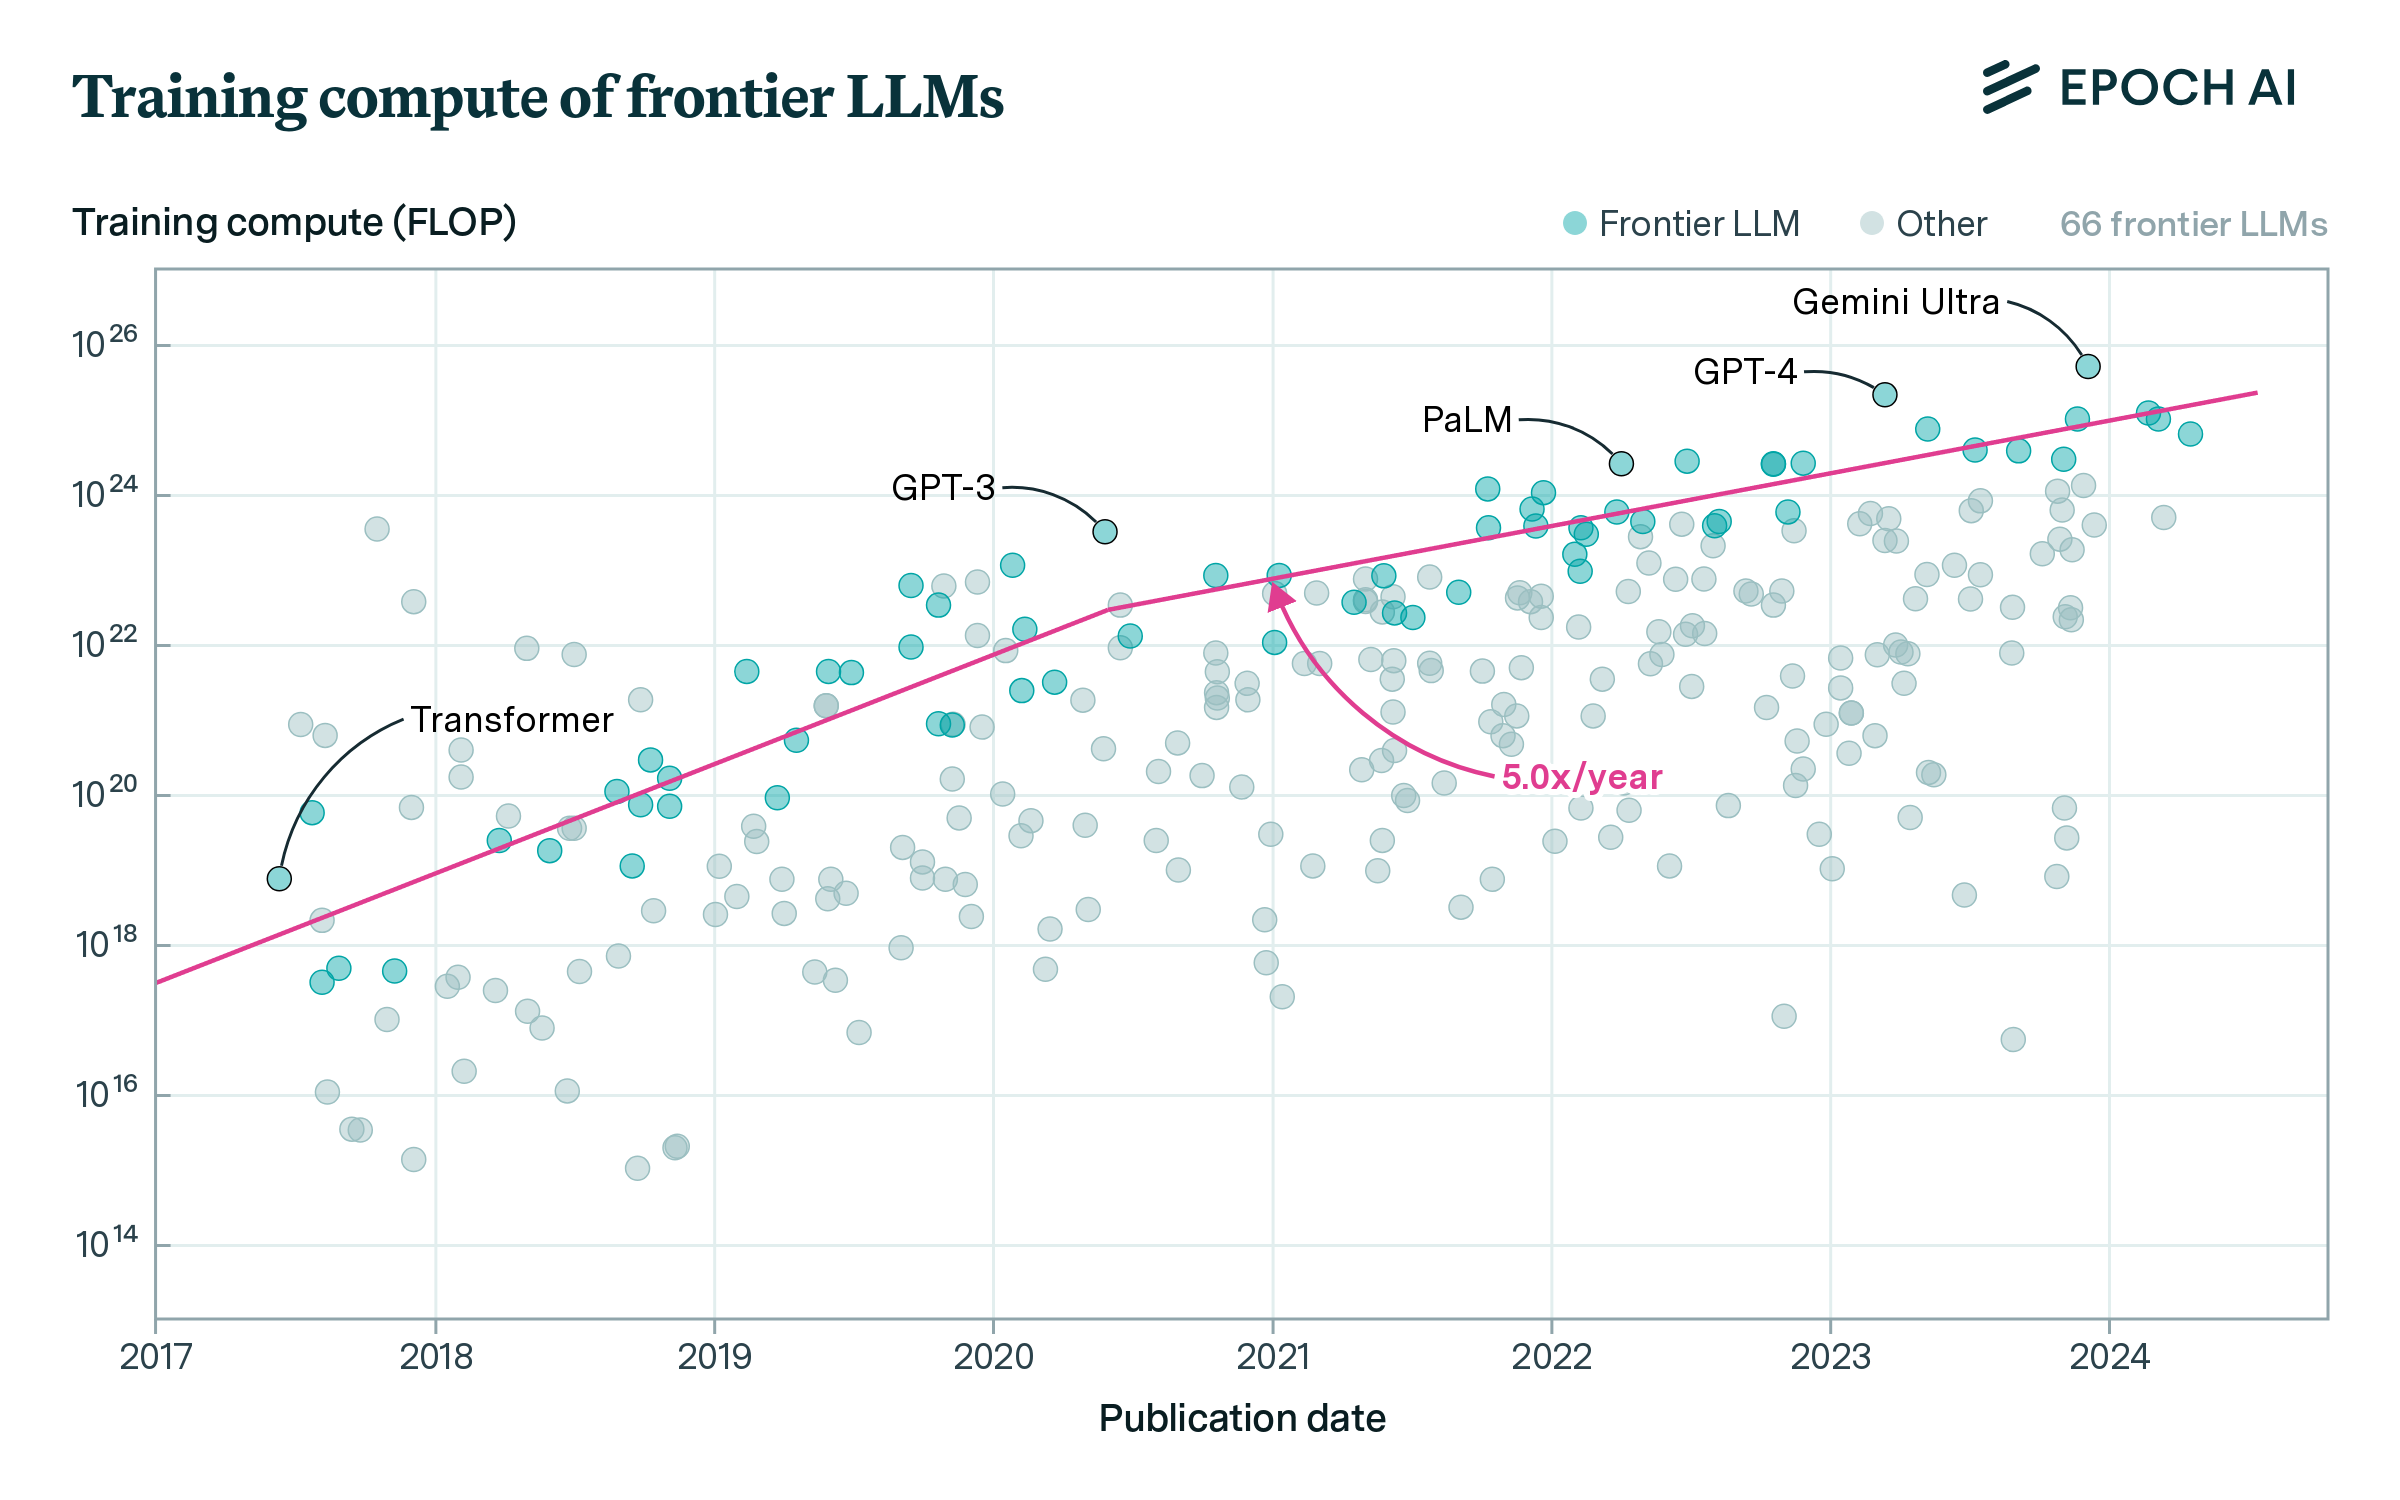
Figure 4: Compute growth in language models as a kinked exponential with two prongs. We find evidence of deceleration around 2020.
Our tentative takeaway is that growth in the frontier of language models can be described as growing by 5x/year in recent years, after having slowed down around 2020 once language models caught up with the frontier of AI. However, the evidence is also consistent with faster growth, up to 7x/year, which would be more congruent with the overall trend in notable language models since the release of the Transformer in June 2017.
Leading companies are growing their top models by 5x/year
Given the concentrated nature of AI development, it also makes sense to analyze the scaling strategies of leading companies. We focus on OpenAI, Google DeepMind and Meta AI, three notable companies that account for two of the three largest models today.12
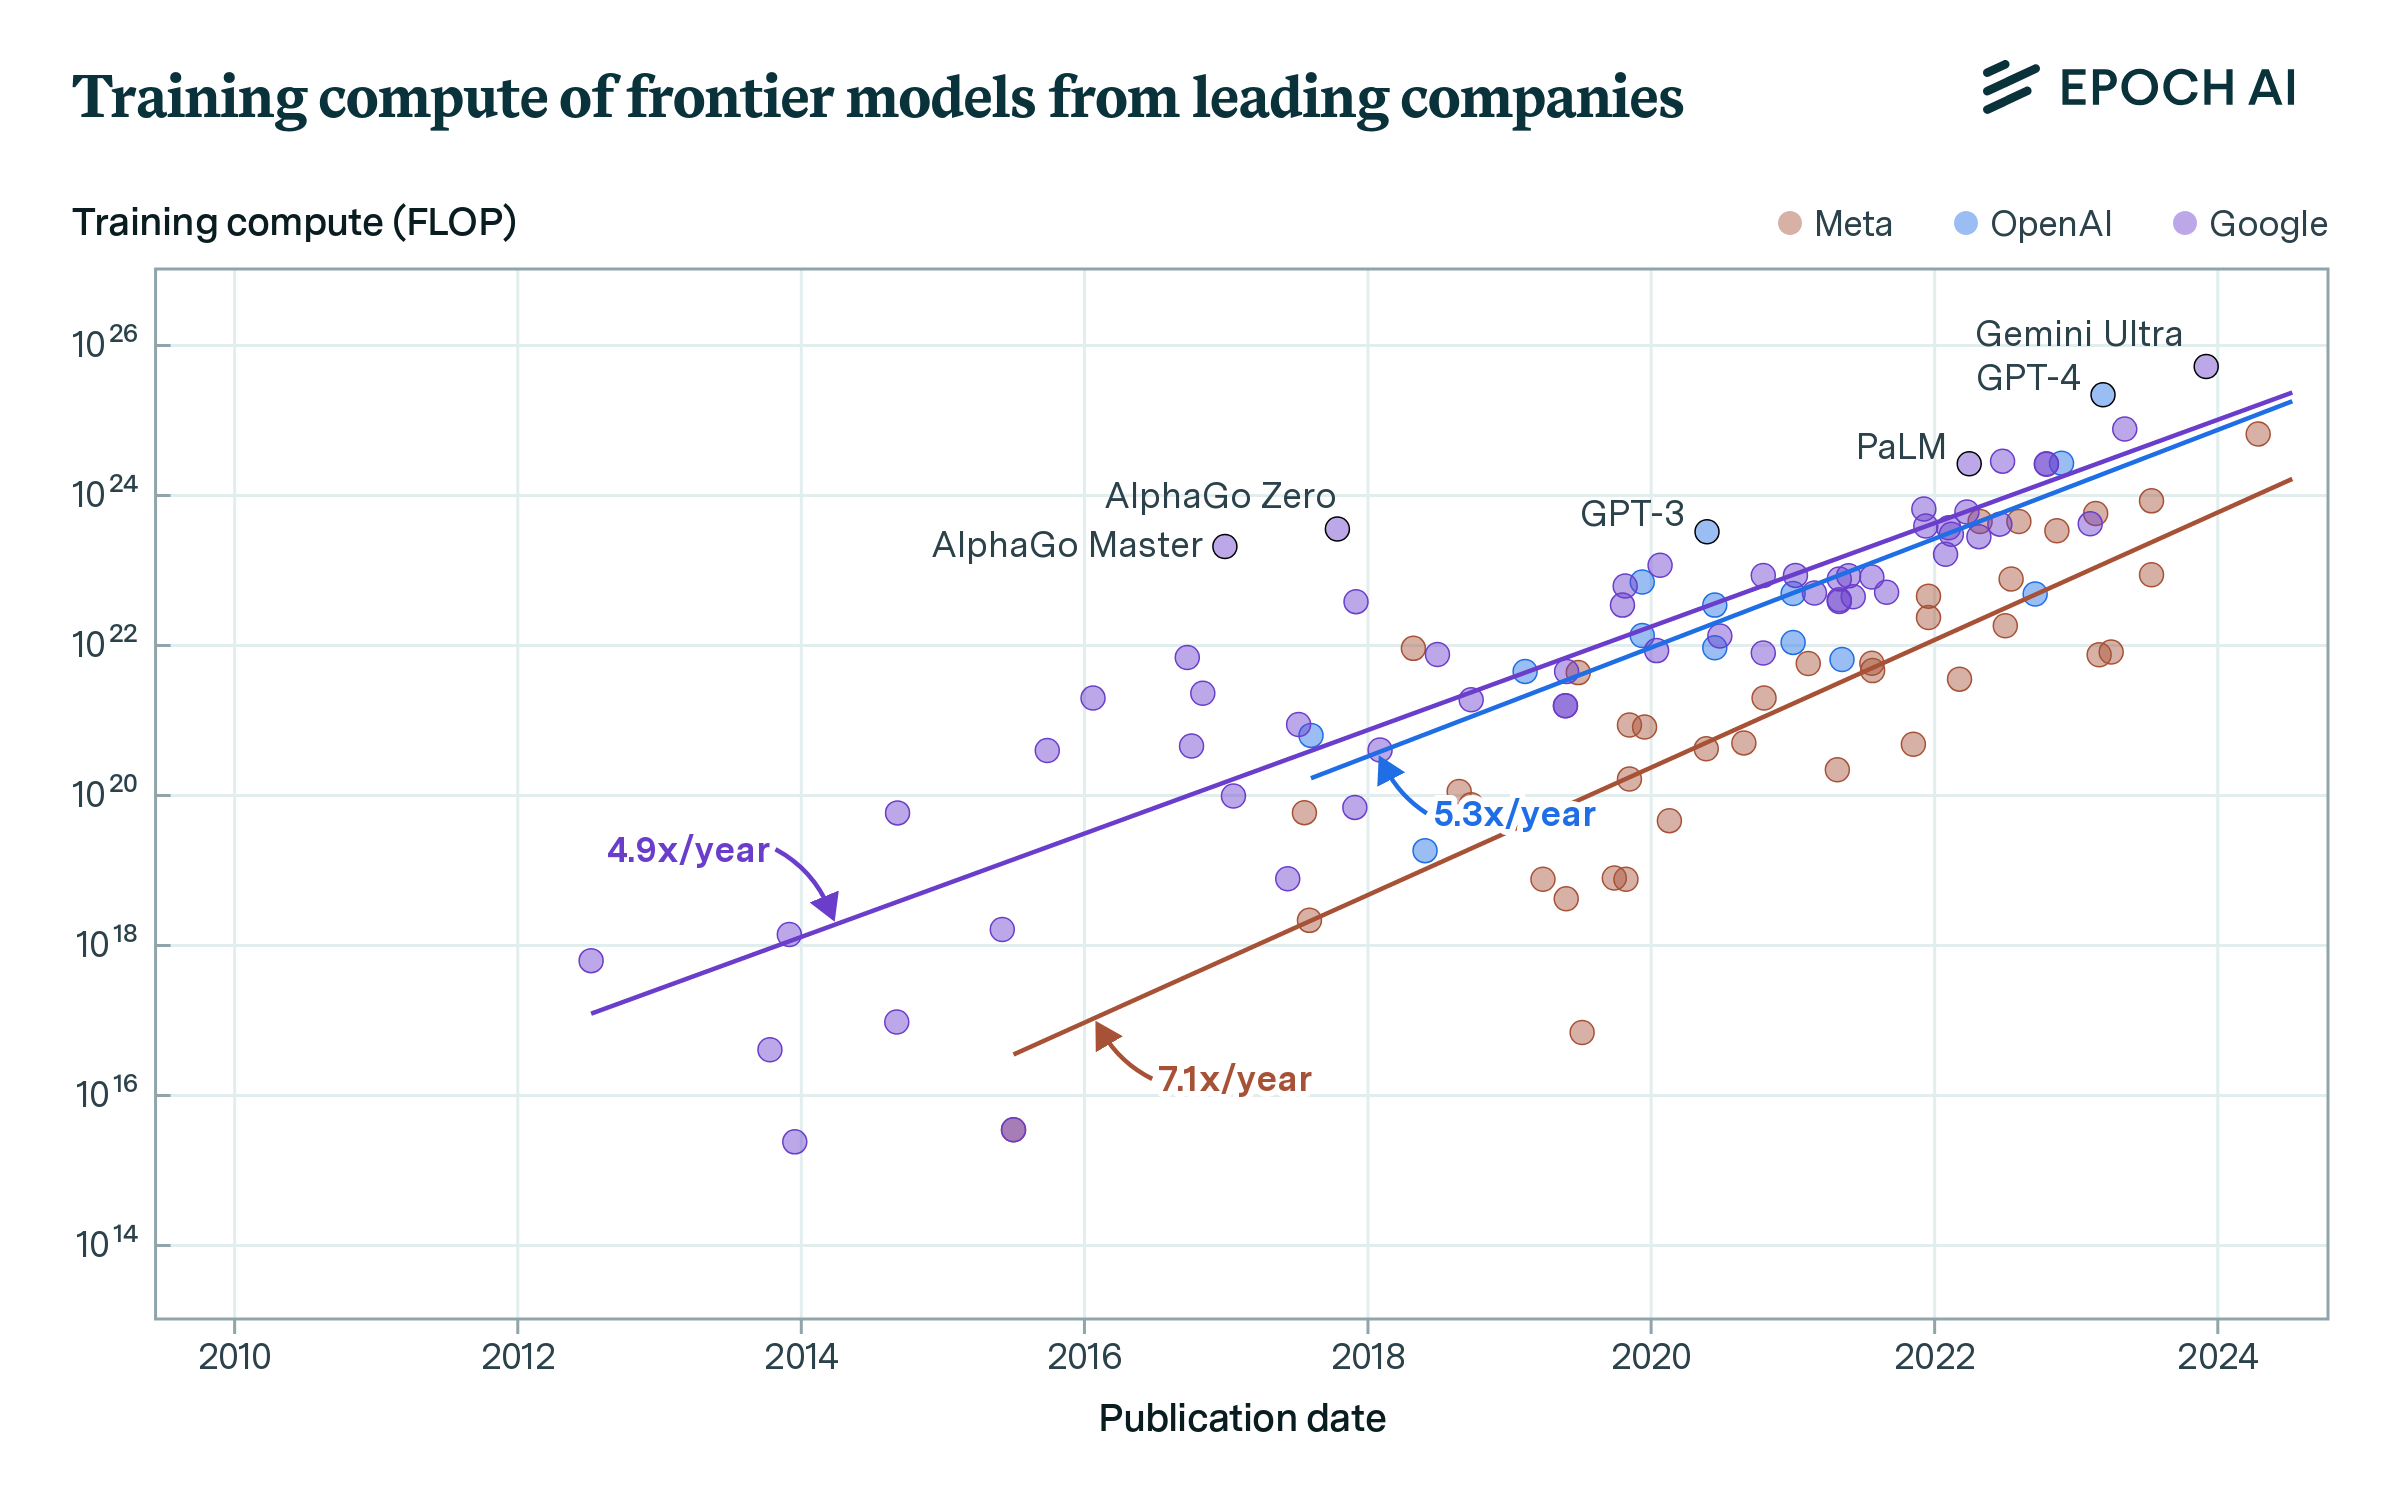
Figure 5: Compute trend of top models developed by OpenAI, Google DeepMind and Meta AI. For each company we only look at models that were at some point in the top 10 of compute within organization releases.13
OpenAI, Google DeepMind and Meta AI’s scaling have all roughly followed the field, with the scale of their top models increasing by 5x/year (90% CI: 3x to 10x) between Aug 2017 and May 2024; 5x/year (90% CI: 4x to 6x) between Jul 2012 and May 2024; and 7x/year (90% CI: 5x to 10x) between Jul 2015 and May 2024, respectively (note the wide confidence intervals). This suggests that the 5x/year figure might also apply to individual companies.14
Google DeepMind recently unveiled Gemini Ultra, one of the largest language models to date, and it may represent a possible acceleration of the scale of their top models. We investigate this possibility and fail to find decisive evidence for it.15 In other words, the recent surge in training compute at Google that enabled models like Gemini Ultra is congruent with their historical trend.
The scale of the largest models today can be retrodicted using a 4-5x/year growth rate
Ultimately, we care about compute growth insofar as it informs our predictions about future growth at the frontier. The largest models today for which we have estimates of their training compute are GPT-4 and Gemini Ultra, estimated by our team to have been trained on 2e25 and 5e25 FLOP, respectively.
How does the 4-5x growth rate we found in previous sections retrodict the size of these models? The largest model at the start of the decade was GPT-3 175B (davinci) by OpenAI, trained using 3e23 FLOP, and released in late May 2020. If we extrapolated a 4x/year trend of compute growth from it, we would predict the largest model to be 1e25 FLOP by March 2023, the release date of GPT-4, and 4e25 FLOP by December 2023, the release date of Gemini Ultra. Had we used the 5x/year trend akin to frontier models before 2020, we would have estimated 3e25 FLOP by March 2023 and 8e25 FLOP by December 2023. The proximity of these estimates to the actual amount of training compute used by Gemini Ultra suggests that these are accurate descriptions of recent trends (see Figure 6).
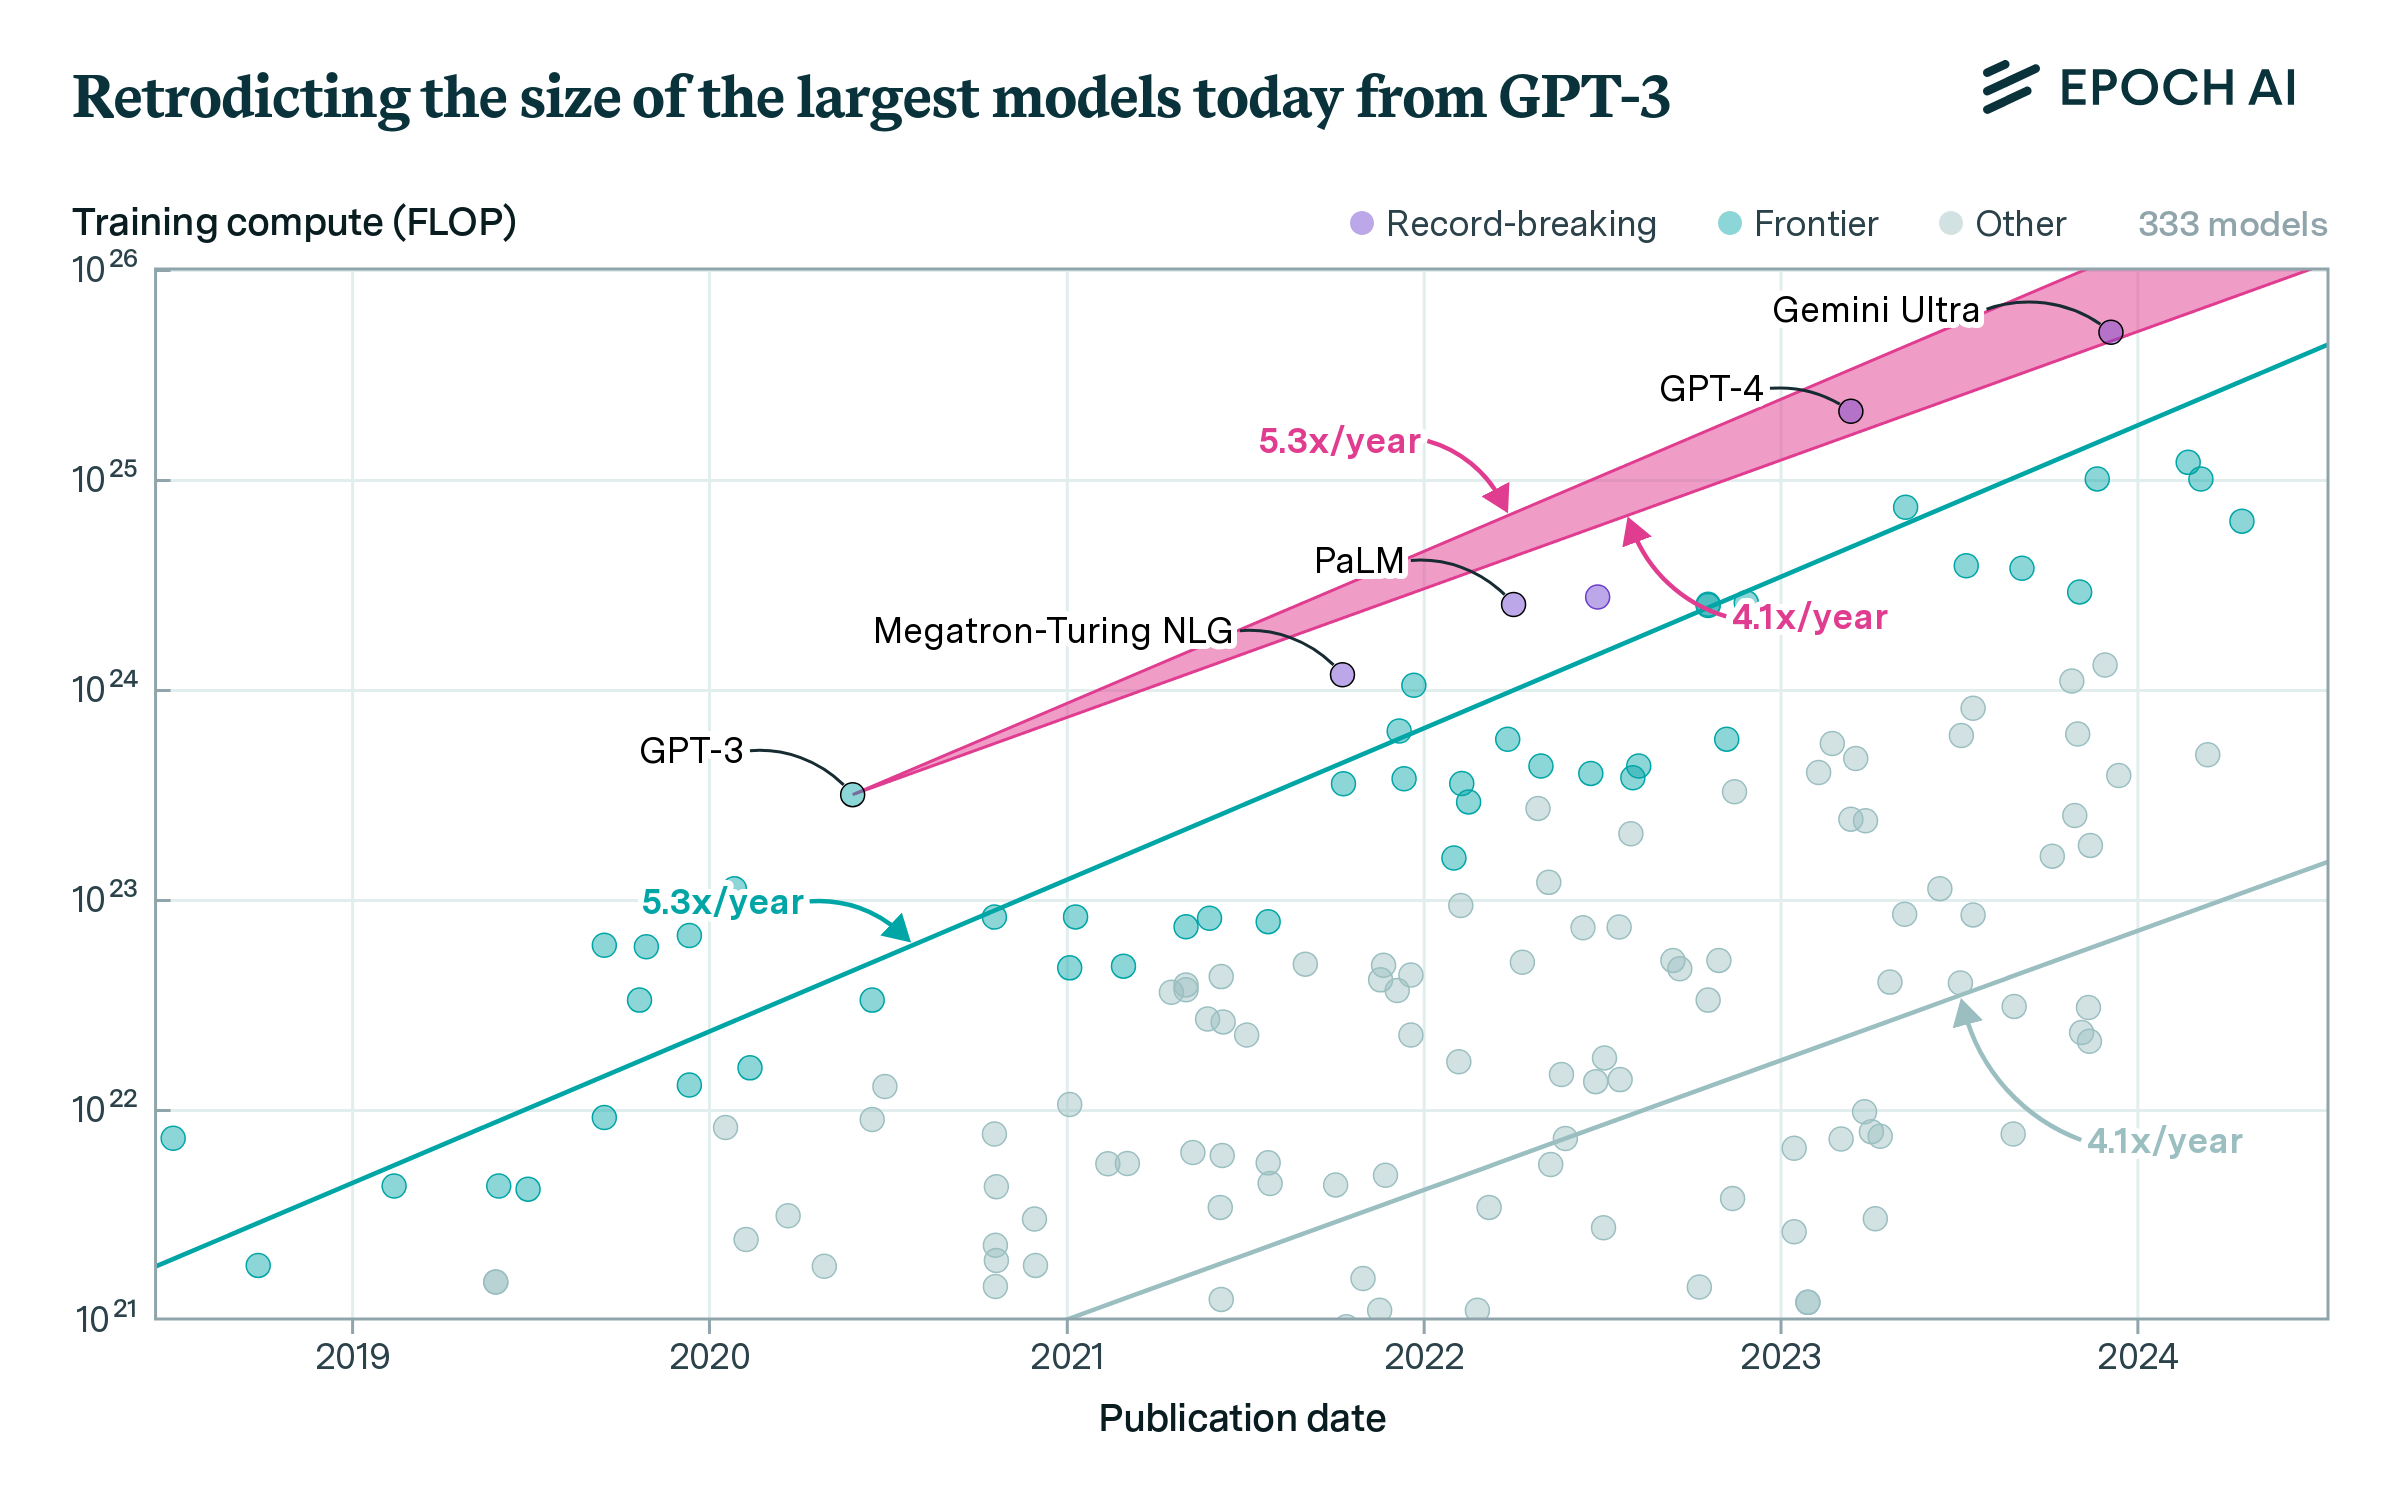
Figure 6: The historical trend for all and frontier models is used to extrapolate the training compute of GPT-3 to predict the compute of the largest models today. Note that many record-breaking systems lie close to the extrapolated line, including Megatron-Turing NLG 540B, PaLM 540B, GPT-4, and Gemini Ultra.
How would we have fared if we restricted ourselves to using data before the release of GPT-3? The overall trend of compute growth for notable models released between 2010 and June 2020 is 3.2 x/year (90% CI: 2.7x to 3.8x), while for frontier models it was 6.9 x/year (90% CI: 5.9x to 8.0x). So a similar approach would have led us to use growth rates between 3x and 7x, leading in turn to a significantly more uncertain projection. However, this projection would still be reasonably consistent with GPT-4 and Gemini Ultra’s training compute.
Conclusion
In this post, we have examined the trend of compute growth in multiple ways. In particular, we have found a growth rate of 4-5x/year for notable models between 2010 and May 2024, for models in the frontier, for the top models released by OpenAI, Meta, and Google DeepMind, and when retrodicting the size of the largest models today.
Ultimately, given the multiple ways we can derive a 4-5x/year growth rate, we think this is an accurate description of recent trends – and likely to hold in the near future, absent new bottlenecks or large breakthroughs.
We have further identified a slowdown in the growth frontier in the last decade. However, we don’t see evidence of slower growth for models in the frontier of compute — we think 4-5x/year is a reasonable descriptor of recent growth in the frontier as well (though we are less certain of this).
For language models, we have seen a much faster growth rate overall, up to 9x/year. But we argue that this rapid growth is better explained as the field catching up to the frontier of AI – if we look at language models in the frontier after mid-2020 we see growth rates of 4-5x.
There are plenty of additional questions we plan to investigate. In this article we have discussed the possibility of discrete accelerations in the growth rate. Taking a longer historical perspective,as we remarked on our previous paper, compute growth also markedly changes if we look before and after 2010. This suggests the possibility of smoothly accelerating growth over time. We will further investigate this possibility in future work.
We are also investigating whether the trend of compute might slow down due to obstacles in data scarcity, willingness to invest, power supply restrictions to data centers, or inability to scale chip production. We will be releasing work on these topics over the next months.
Meanwhile, we recommend summarizing the recent trend of compute growth for notable and frontier models with the 4-5x/year figure. This should also be used as a baseline for expectations of growth in the future, before taking into account additional considerations such as possible bottlenecks or speed-ups.16
Compute is the best predictor of broad AI capabilities we have, and so tracking its growth is fundamental to forecasting the trajectory of AI. This piece provides an updated view of this crucial topic and argues for a growth trend that has not slowed down in recent years.
We thank David Owen, Tim Fist, Mauricio Baker, Tamay Besiroglu, Markus Anderljung, Ben Cottier and Ege Erdil for comments and discussion.
We are also immensely thankful for the labor of the Epoch data team, and particularly Robi Rahman and Joshua You for the data collection effort that informs this work. We also thank Robert Sandler for his work on visual design that elevated the graphs in this post.
Appendices
Appendix 1: Compute trends model selection
In this appendix we show the results of our model selection process for modeling the trend in compute growth. We fit simple, kinked and discontinuous exponentials, as well as hyperbolic growth models.
The main model selection metrics we report are the Bayesian Information Criterion (BIC) score and the mean square error (MSE) for a 10-fold cross-validation. We also include the result of a chi-squared test evaluating whether each model is a better fit than the simple exponential model. We report alongside them the slopes and break points for the (piecewise) exponential models.
Quantiles for a 80% CI of each reported metric are derived from bootstrapping the sample 1000 times. We also report the distribution of the BIC difference between each model and a simple exponential model within each bootstrap sample. We report alongside it the % of samples in which the model is preferred over a simple exponential.
When fitting the piecewise models, we choose the BIC-minimizing break point. We also exclude break points that would lead to having fewer than ten datapoints in one segment. This helps regularize the results.
When fitting the hyperbolic model, the bootstrapped sample would sometimes result in an error when the hyperbolic could not be fit within a given number of steps. This happened fewer than 5 times per 1000 samples across all our analyses. We discard these failed fits.
Notable models
None of the models is robustly preferred over a simple exponential model, though the hyperbolic model is preferred in many bootstrap samples. See Table A1.
Frontier models (top 10)
We find that allowing for either a discrete acceleration or a discontinuous break of the exponential is robustly preferred (Table A2). This also holds if we exclude compute outliers AlphaGo Zero and AlphaGo Master (Table A3).
Language models (post-transformer)
We find that a simple exponential model is preferred to model the overall trend in language models (Table A4). If we look at the running top 10 of language models by scale, a fit with a discontinuity is preferred instead (Table A5).
Google DeepMind top models
While according to the BIC a discontinuity is preferred, the K-fold mean MSE does not corroborate this. Thus we default to the simple model.
Appendix 2: Top-N frontier sensitivity analysis
In this appendix, we investigate the sensitivity of our results for frontier models when we define “frontier models” as the running top N of models of compute for values of N between 1 and 20. We conclude that the results are relatively robust. Concretely, we find that growth rates are relatively stable across different values of N. We also find that a model with a discontinuity is robustly preferred to a model of simple exponential growth for most values of N.
Appendix 3: Summary of main results
Here we summarize in a single place the main results from the article.
Notes
-
Our 2022 analysis found a trend of growth of compute of 4.4x/year (95% CI: 3.8x to 5.3x) for models between 2010 and 2022. ↩
-
Our 2022 paper included compute estimates for 98 notable models between 2010 and 2022. At the time of writing, the current database includes 333 compute estimates for notable models released between 2010 and May 2024. ↩
-
For this estimate and throughout the article, we report the slope for a log-linear fit. Confidence intervals are derived through the bootstrap method. Code for all analyses presented can be found here. ↩
-
The simple exponential model is slightly preferred according to the BIC criteria, though slightly disfavoured by MSE in a 10-fold crossvalidation. Neither result is robust. See table A1 in the appendix for details. ↩
-
In particular, our previous definition included models that were 0.76 standard deviations above the mean in any 2 year period window, in logarithmic scale. We chose the threshold to intuitively match our intuition of what was to be considered a frontier model, and checked the robustness of our results against different thresholds in an appendix. ↩
-
Concretely, with the previous definition and our current data we would have found a trend of 3.7 x/year (90% CI: 3.4 to 4.0) for large scale models between 2010 and May 2024. ↩
-
This trend is robust to the choice of top N. For N between 5 and 20 we see best fit slopes between 5.15x and 5.44x for frontier models between 2010 and May 2024. See table A7 in the appendix for details. ↩
-
Concretely, in the old paper we found a growth rate of 2.3x/year (95% CI: 1.6x to 3.0x) for our previous definition of large-scale models in the 2016 to 2022 period. ↩
-
Lohn looks at models that are within 10% of the compute of the previous record holder, and reports finding a BIC score difference in favor of a kinked exponential model of 32. Note that Lohn looks in his analysis at models that are within a 10% of the compute of the previous record holder. This definition is more sensitive to outliers than our preferred one. ↩
-
When looking at all models, the preferred model is one allowing a piecewise exponential growth, with a discontinuity in between. If we exclude compute outliers AlphaGo Master and AlphaGo Zero the preferred model is a continuous exponential with a discrete change of slope. Either model is strongly preferred over a simple exponential. See tables A2 and A3 in the appendix. This conclusion is robust to different choices of N when looking at the running top N models, see table A7 in the appendix. ↩
-
We only have 21 notable language model compute estimates recorded before June 2017. We focus on models after the release of Attention Is All You Need in June 2017, as it is a major recognized landmark in language modelling and introduced the now-dominant Transformer architecture. ↩
-
Anthropic is also worth considering. However, they are newer and have released fewer models, so it is more difficult to study trends for this company. ↩
-
In OpenAI’s case, we exclude the model in the paper that introduced Adam, since it was published before OpenAI officially started and the paper goal was to showcase a training technique rather than developing a state-of-the-art model. For Google DeepMind, we include both models by Google Brain and DeepMind before and after their merge in April 2023, as well as models attributed to Google Research and Google. For Meta AI we include models attributed to Facebook more generally, and Meta AI (including models released under their previous name of Facebook AI Research). ↩
-
If we focus only on the flagship GPT models by OpenAI we would find an apparently much faster trend of growth, growing by 10.9 x/year (90% CI: 4.0 to 62.6). But this is an incredibly noisy trend, since it only includes five models, and it would be better fit anyhow by a trend that slows down over time. Ultimately, we think that looking at the whole sample of models by OpenAI is more representative of the overall trend of compute scaling within the company. ↩
-
A model with a discontinuity is preferred by its BIC score to a simple exponential, but the slope and whether we find an acceleration or deceleration varies depending on the exact modeling details. Neither model with a discontinuity surpasses the simple exponential in terms of cross-validation MSE. See table X in the appendix. ↩
-
We mentioned some possible bottlenecks in the paragraph above. On speed ups, one plausible candidate is an expectation of explosive economic growth driving high investment. ↩
About the authors


Related posts